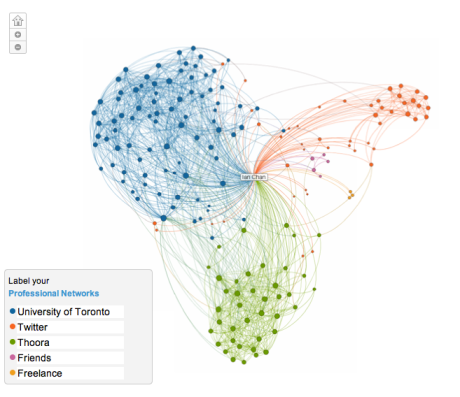
I am always interested in looking at large sets of data. Earlier today, LinkedIn released InMaps which provide a simple tool for visualizing one’s network on LinkedIn. After a few seconds of processing, I was presented with this colorful and interactive visualization of the ~200 connections I have on LinkedIn. Now I don’t have quite as many connections as others, but I was still very impressed with the powerful bits of information I was able to quickly get out of this graph. The plotting algorithm did a pretty good job, as I see 3 major clusters which are composed of my University of Toronto connections, the connections I made at my previous startup Thoora, and the connections I have made (mostly coworkers) since I moved to San Francisco for Twitter.
Archives for posts with tag: linkedin
