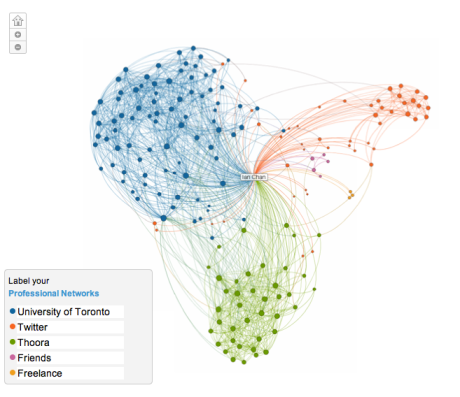
I am always interested in looking at large sets of data. Earlier today, LinkedIn released InMaps which provide a simple tool for visualizing one’s network on LinkedIn. After a few seconds of processing, I was presented with this colorful and interactive visualization of the ~200 connections I have on LinkedIn. Now I don’t have quite as many connections as others, but I was still very impressed with the powerful bits of information I was able to quickly get out of this graph. The plotting algorithm did a pretty good job, as I see 3 major clusters which are composed of my University of Toronto connections, the connections I made at my previous startup Thoora, and the connections I have made (mostly coworkers) since I moved to San Francisco for Twitter.
The legend for the clusters was manually added, and I am curious if LinkedIn is using that data for something other than just a label. Either way, a very impressive, free, quick view of what I can imagine must be a ton of data. I can only predict over time that orange ball will grow, and likely split into two clusters as I connect with more coworkers, and connect with more tech geeks in the city.
This tool and graph gives some insight into the power of the data and network information that LinkedIn is housing. I constantly tell my friends and coworkers about how there are many *hidden* values of LinkedIn for which I appreciate, this tool being one of them. Unlike my Facebook account, I am not terribly interested in the general day-to-day updates of my network, but much more interested in the network itself. Who do I know? who am I connect to? and who might find me because I am connected to someone else? I’d say that to me, Twitter is all about the sum/collection of the individual tweets. Facebook is about the sum of the individual micro-interactions, and LinkedIn is all about the strength, and the quality of the social graph itself. This tool helps reinforce my opinion that my LinkedIn graph is much stronger and stable than my ever growing graph on Facebook.
Some nice slick looking vector graphs backed by Rapheal.js and smooth as butter zooming and panning powered by Microsoft’s Seadragon Ajax. This reminds me that I need to: (a) Find a cool large public data set. (b) Visualize some data. Try it out for yourself here.

[…] various clusters of people in my network have with each other. I compared my graph to several of my friends’; it was interesting to note the differences. Especially with regards to how closely grouped the […]